
As an even more competitive and fast-paced digital environment has in-store, it is near needless to say but attracting and retaining attention is quite difficult.
When there is an info-overload, it becomes really hard to make your content stand out. This is where infographics help – they are one of the most strong visual aids that one can use to turn difficult data into an eyeful and brain-friendly format.
Attraction: Nice pictures are highly attractive, drawing people in and significantly enhancing content appeal. They serve as a visual hook, encouraging viewers to explore further and delve deeper into the information provided.
Asks New Questions: Intriguing visuals possess a unique power to stimulate thought and raise new questions in the viewer's mind. By presenting unexpected elements, unusual perspectives, or subtle details, they spark curiosity and encourage deeper contemplation.
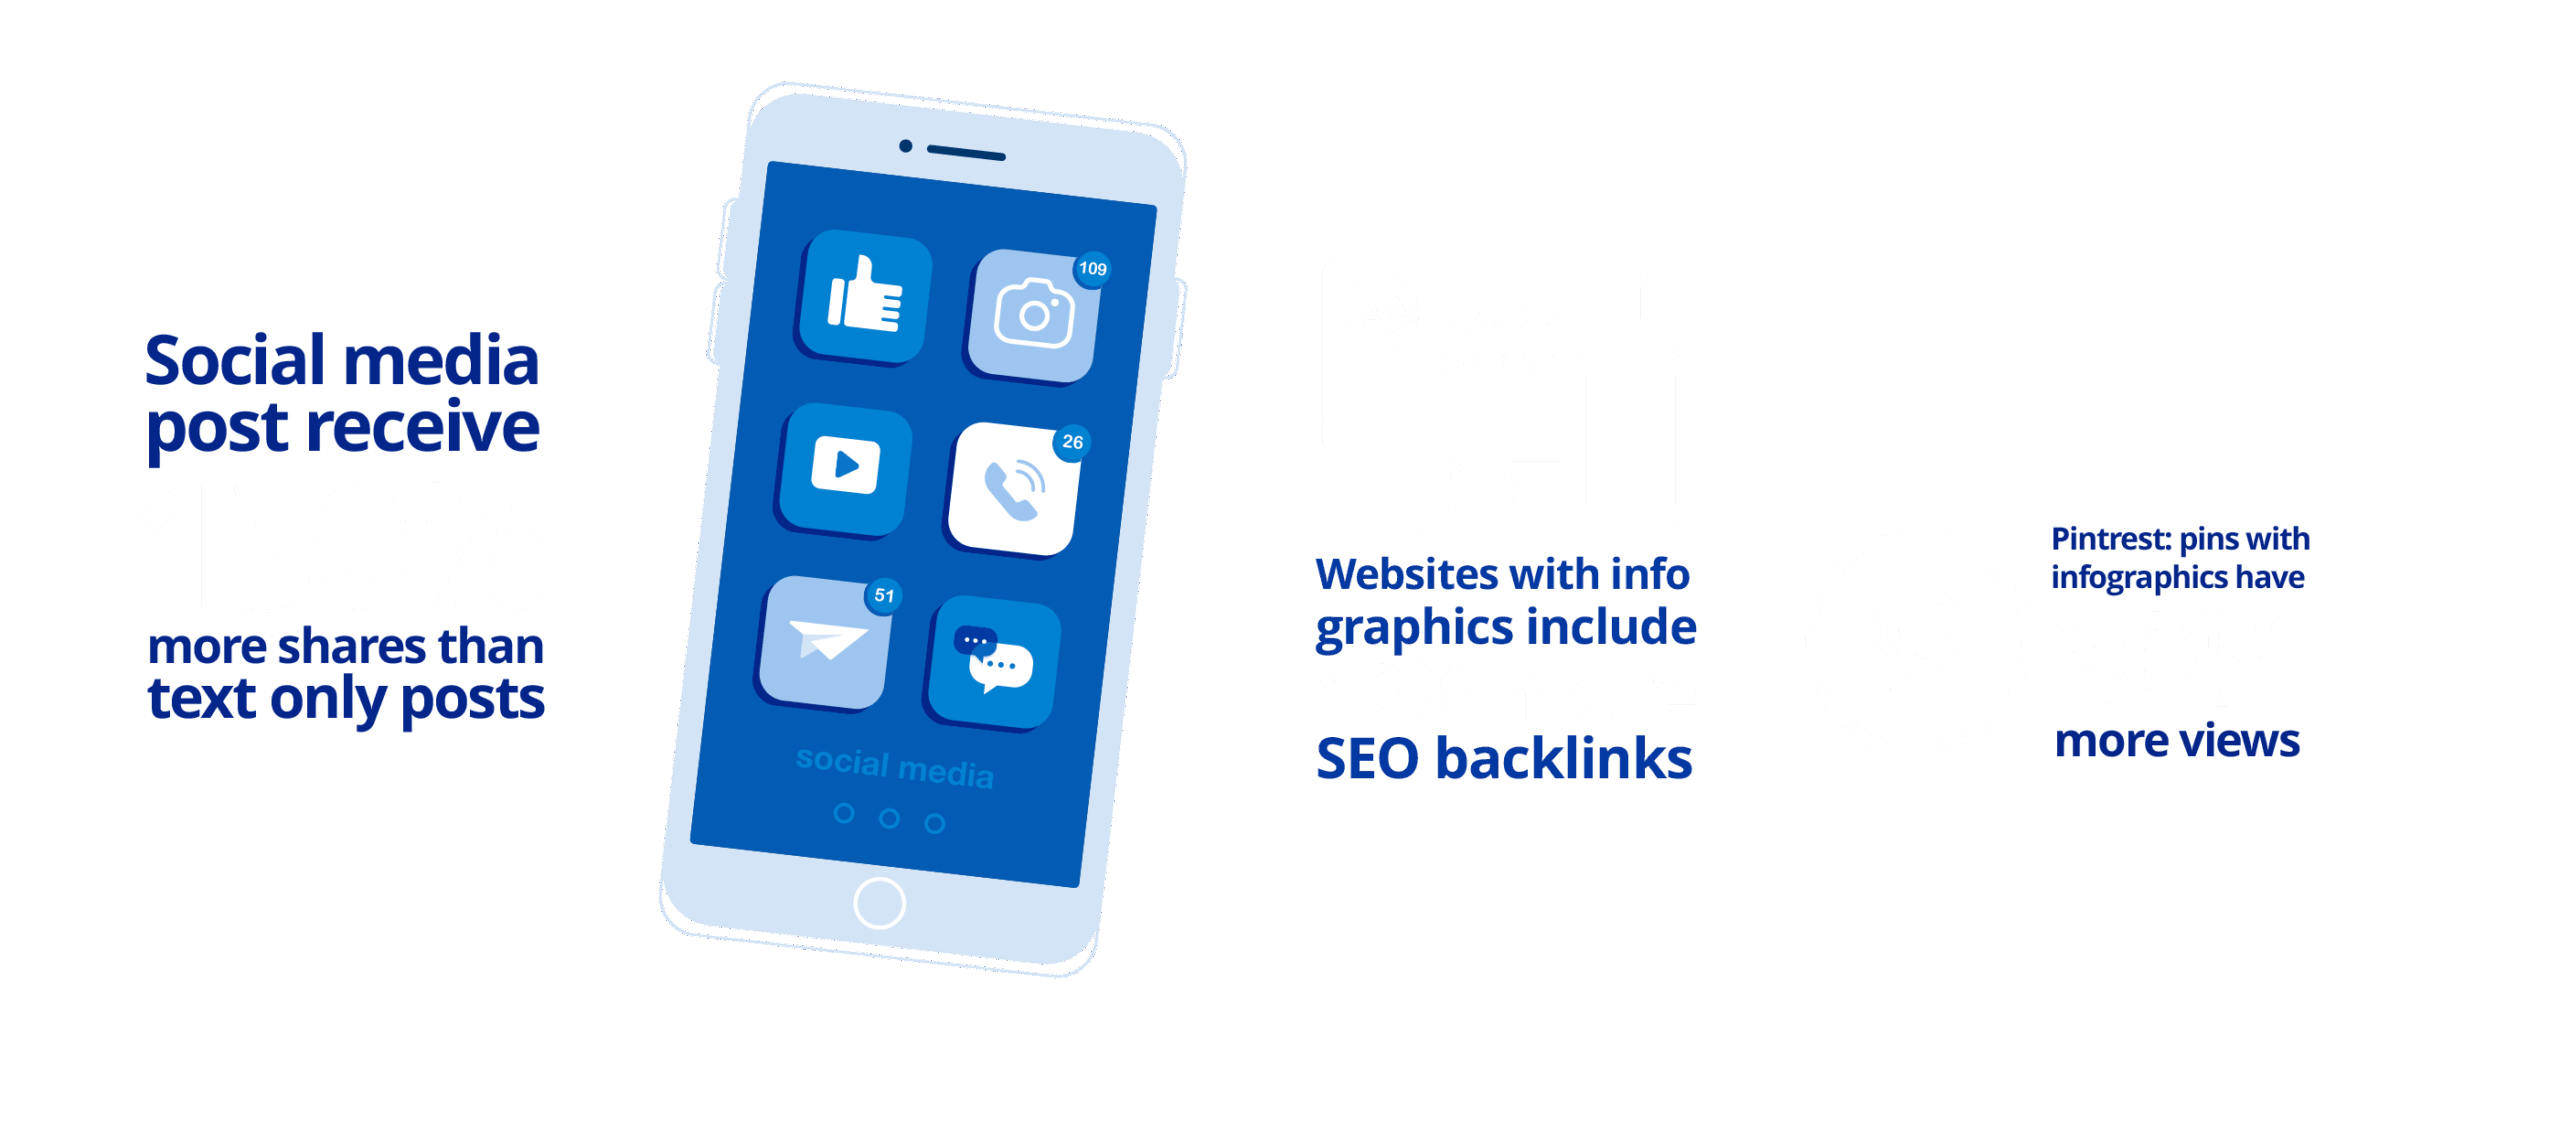
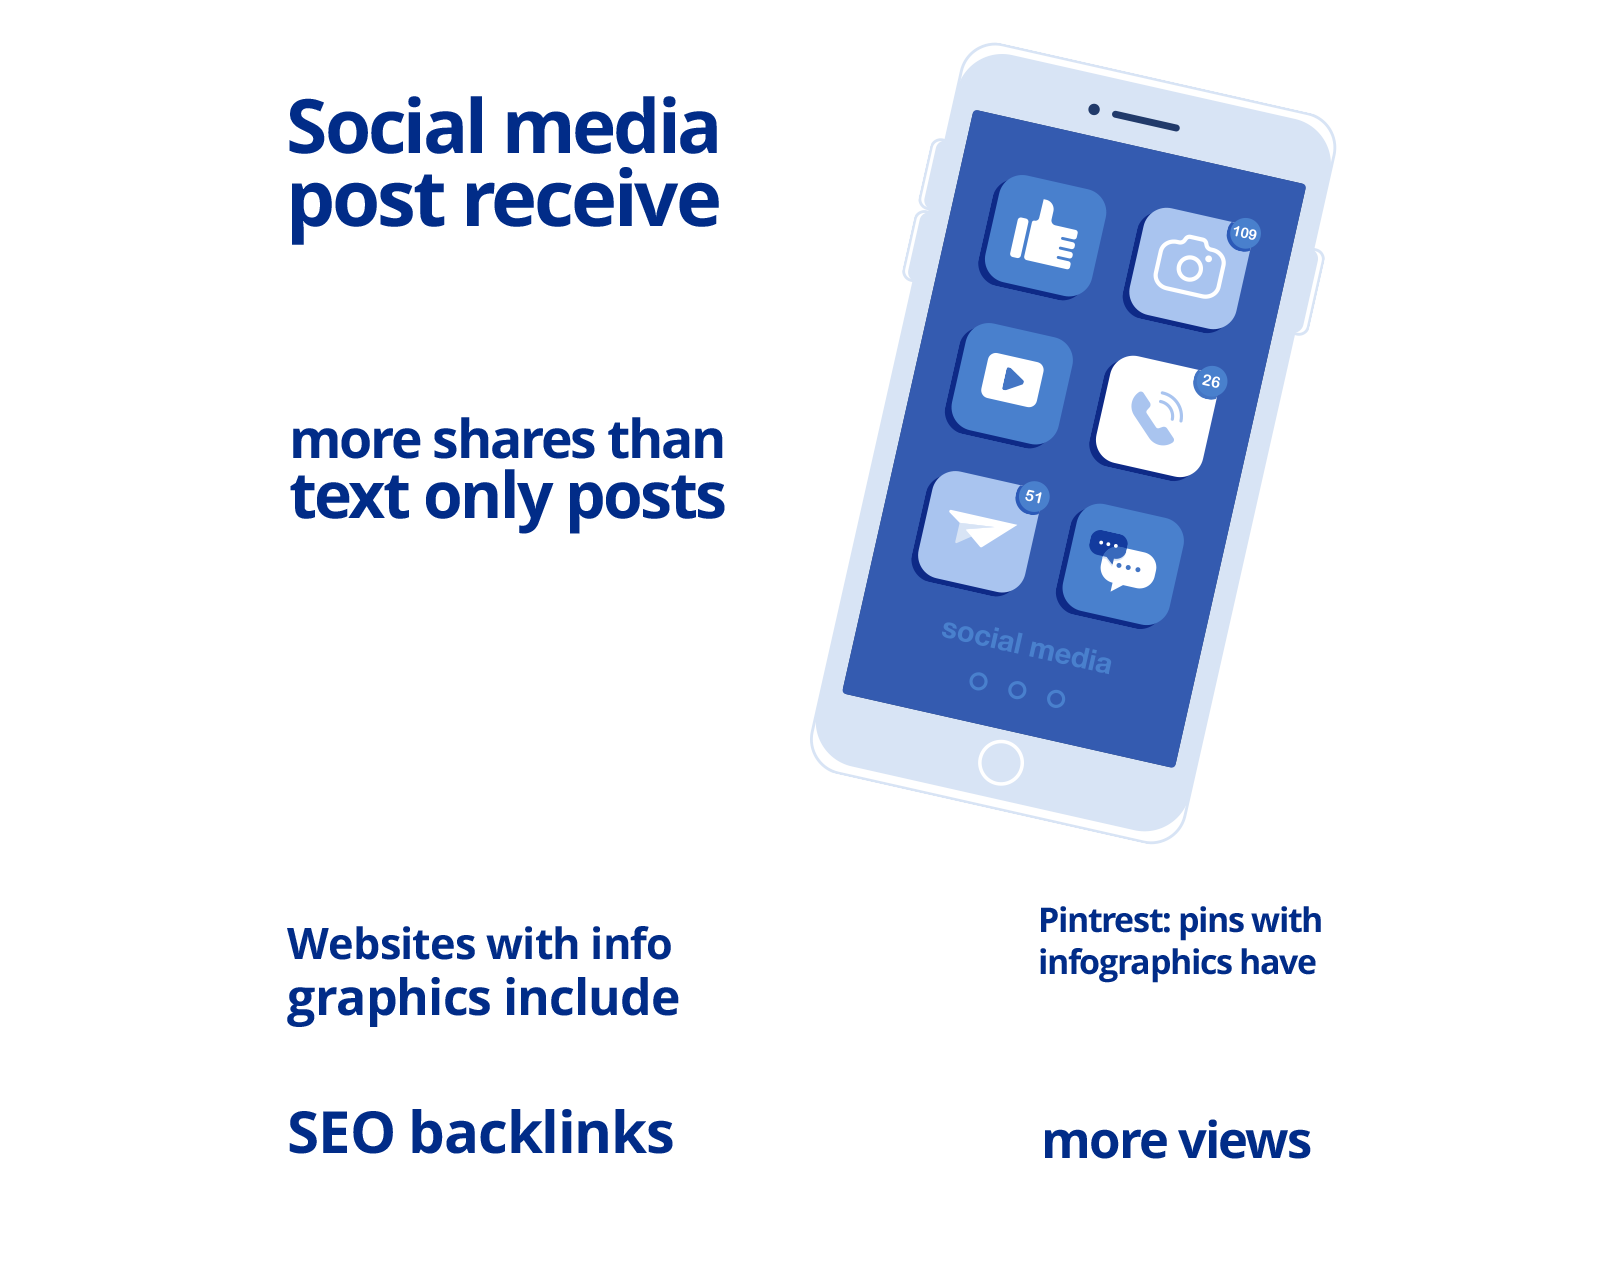
Boosts Your Shareability: Content significantly benefits from strong visual elements, which inherently increase its likelihood of being shared, particularly across social media platforms. Engaging images and videos are more eye-catching and easily digestible in fast-paced feeds.
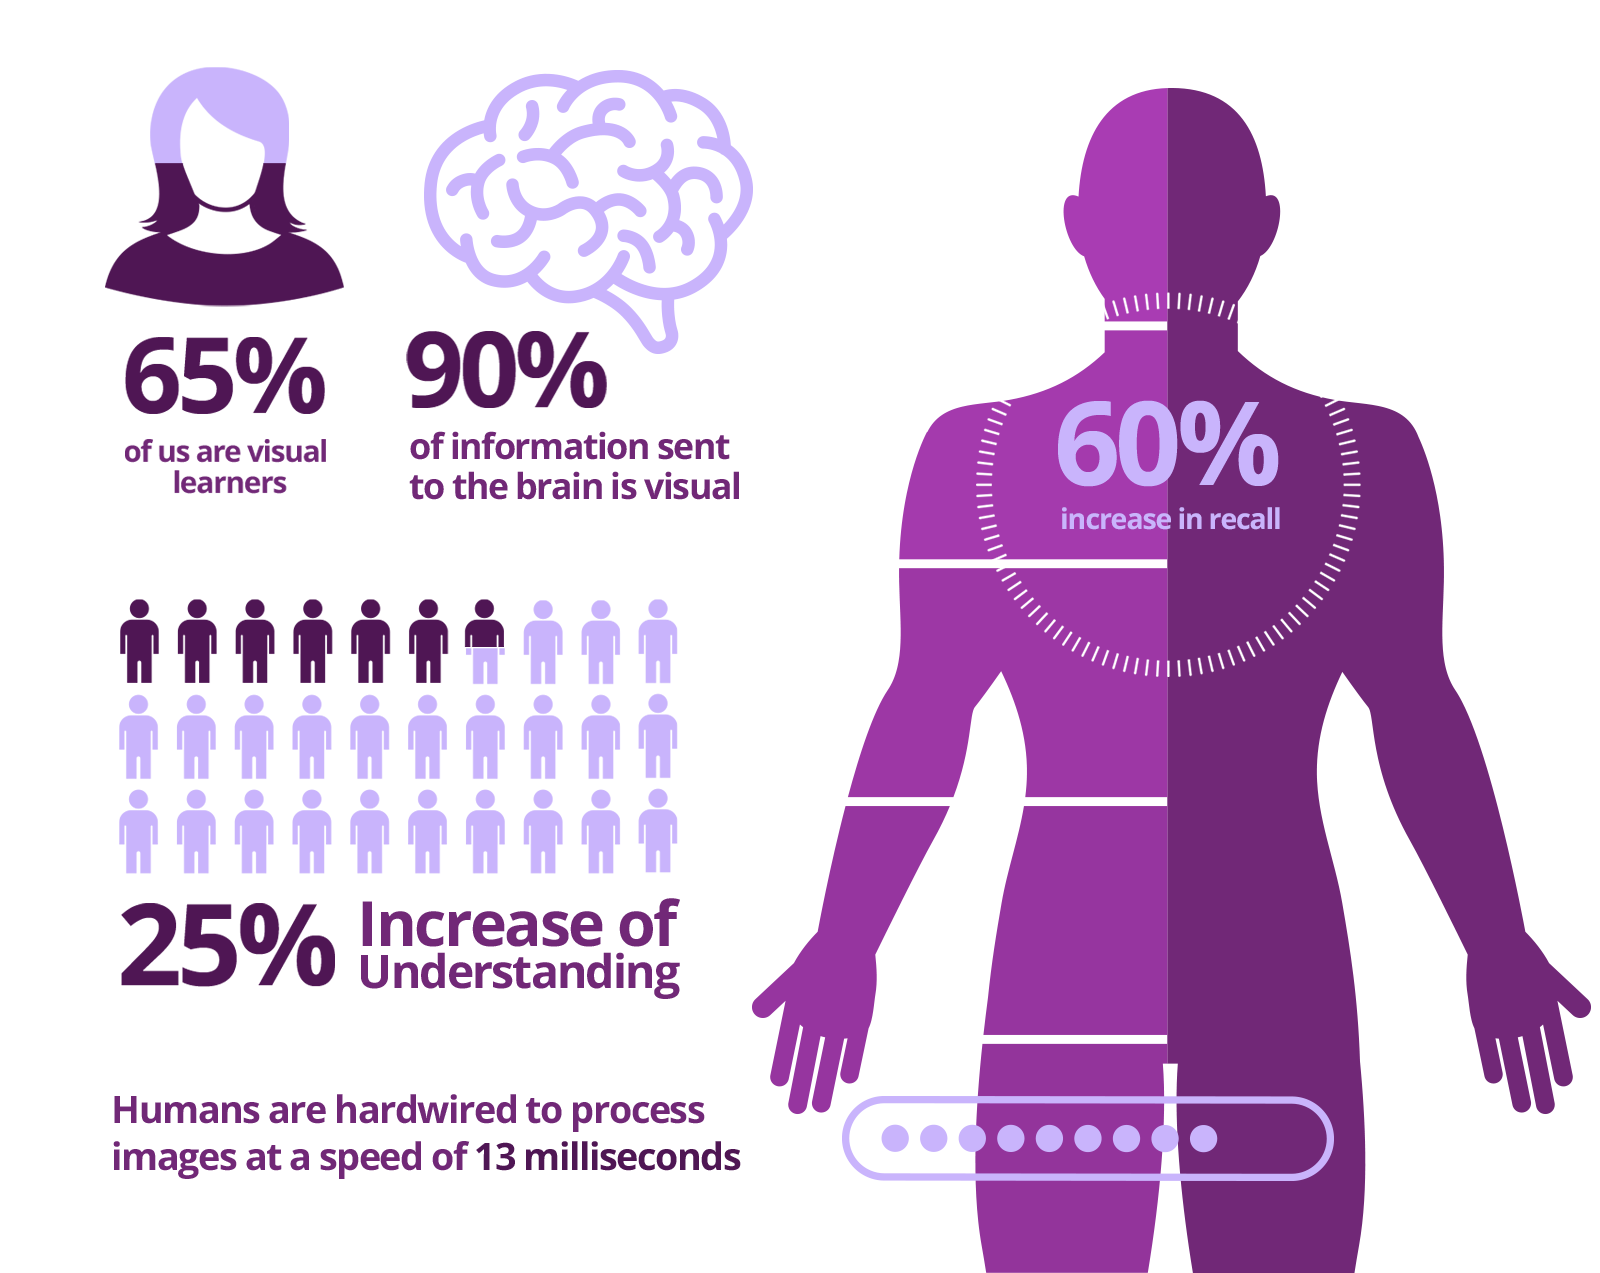
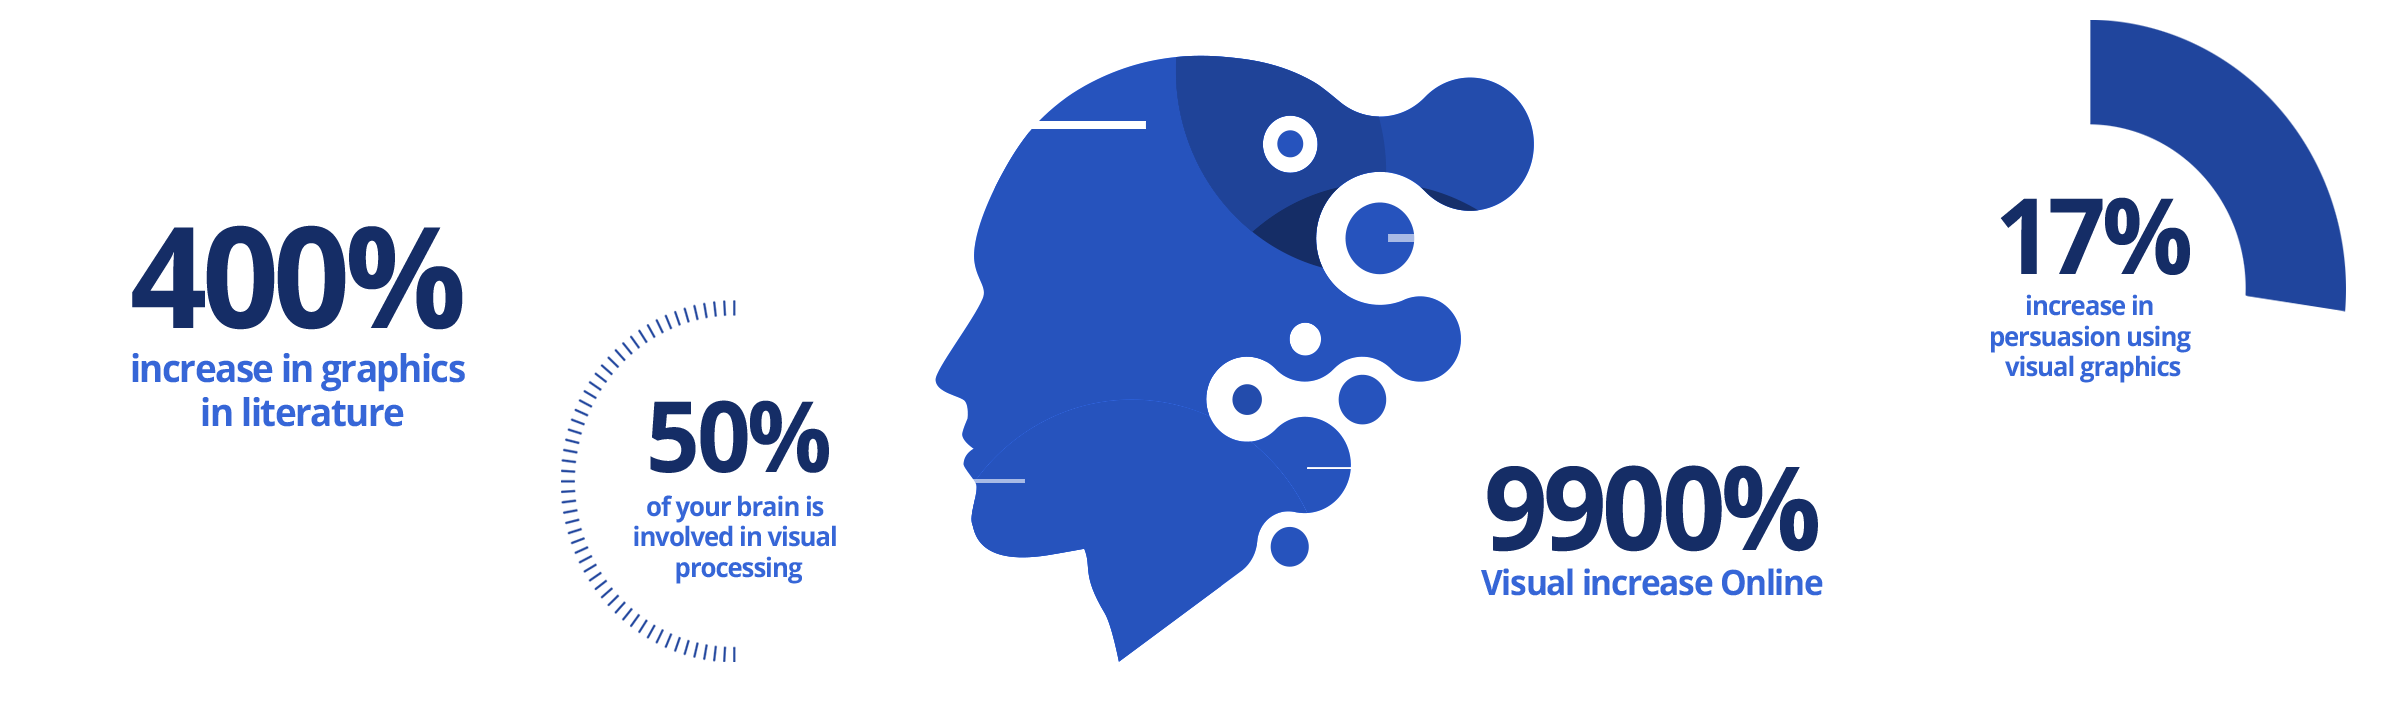
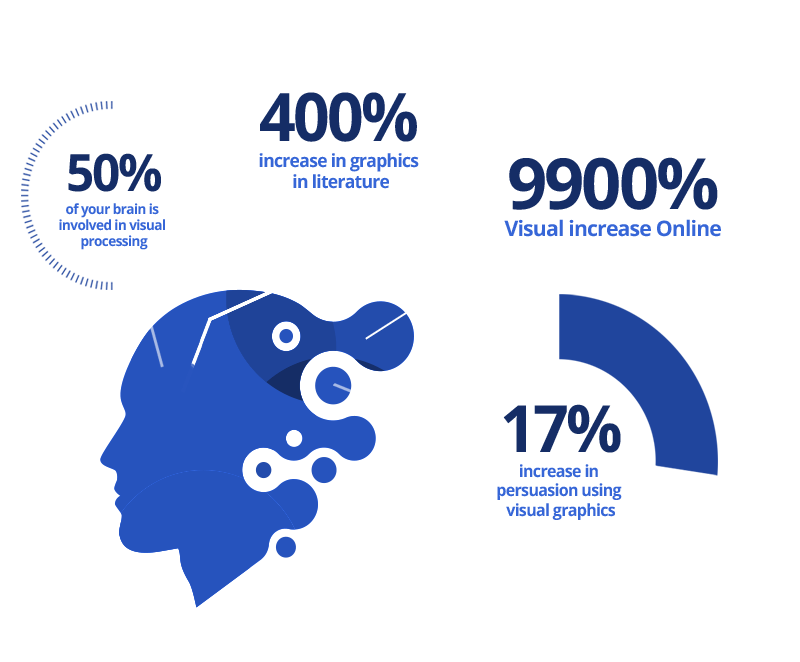
Infographics: Simplify Complex Data: Infographics excel at transforming complex data sets into easily understandable formats. By visually breaking down intricate information into smaller, digestible components like charts, graphs, and icons, they make complicated subjects accessible.
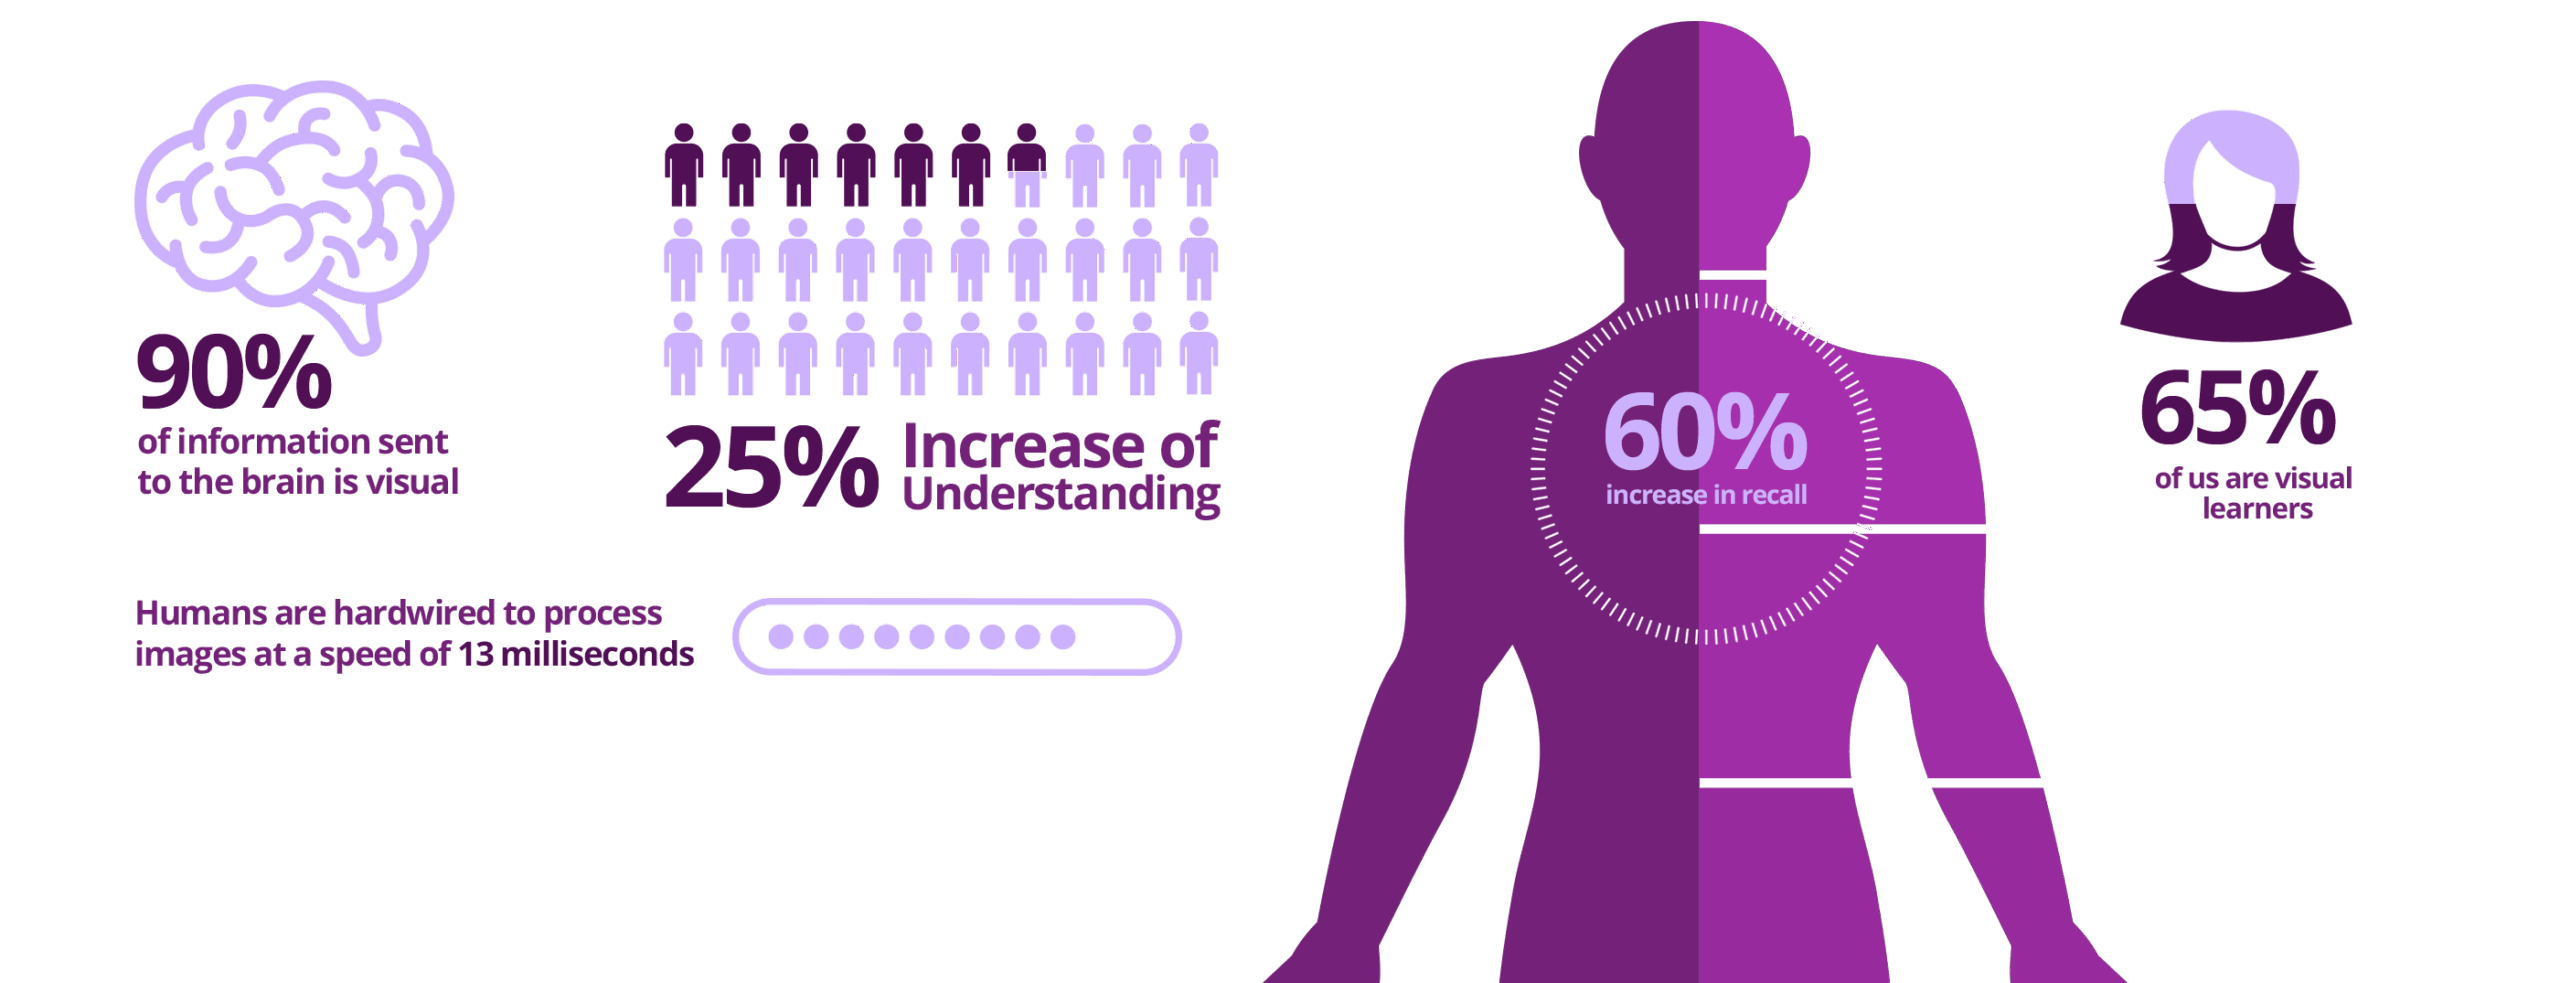
Enhances Information Retention: Visual elements act as powerful cues for the brain, significantly improving how well we remember information. When data or concepts are paired with relevant imagery, they create stronger memory traces.
Shows Relationships: Visuals excel at illustrating relationships and patterns that might remain hidden or unclear within standard text. Through elements like diagrams, charts, and graphs, images can clearly depict connections, trends, and hierarchies between data points or concepts.
Divides Up Text: Visuals serve a crucial role in breaking up extensive sections of text, preventing content from appearing as a dense, intimidating block. Incorporating images, charts, or infographics provides visual breathing room for the reader.
Improves SEO: Content enriched with visuals is significantly favored by search engines. Images, videos, and infographics help search algorithms understand content better and are seen as indicators of quality and user engagement.
Dwell Time Increases: Engaging and visually appealing elements play a key role in keeping visitors on your website for longer periods. Eye-catching images, videos, or interactive graphics immediately grab attention and make the content more inviting to explore.
Your data holds immense potential, but only if it can be understood and acted upon. By embracing thoughtful graphic design and data visualization, you can transform those dry numbers into compelling narratives that inform, engage, and persuade.
Ready to stop putting your audience to sleep with spreadsheets? If you want to turn your data into clear, engaging visuals that drive results, let's talk. Our team can help you find the story in your numbers and tell it beautifully.